Example Notebook for the COCOScorer Implementation
This example notebook demonstrates how to use the COCOScorer class to generate detection scores using the COCO and COCOEval APIs. For this notebook, we use a sample test image and COCO-format annotation file from the VisDrone dataset.
Table of Contents
To run this notebook in Colab, use the link below:
![]()
Set Up the Environment
Note for Colab users: After setting up the environment, you may need to “Restart Runtime” in order to resolve package version conflicts (see the README for more info).
Note: We are suppressing warnings within this notebook to reduce visual clutter for demonstration purposes. If any issues arise while executing this notebook, we recommend that this cell is not executed so that any related warnings are shown.
import warnings

warnings.filterwarnings("ignore")
import sys  # noqa: F401

!{sys.executable} -m pip install -qU pip
print("Installing nrtk...")
!{sys.executable} -m pip install -q nrtk
print("Installing torch and torchvision...")
!{sys.executable} -m pip install -q "torch!=2.0.1" torchvision
print("Installing smqtk-detection CenterNet model (pretrained on the VisDrone dataset) ")
!{sys.executable} -m pip install -qU smqtk-detection[centernet]
print("Installing headless OpenCV...")
!{sys.executable} -m pip uninstall -qy opencv-python opencv-python-headless  # make sure they're both gone.
!{sys.executable} -m pip install -q opencv-python-headless
print("Done!")
Installing torch and torchvision...
Installing smqtk-detection CenterNet model (pretrained on the VisDrone dataset)
Done!
Select Sample Input Image and Detections
For this notebook, we use a sample test image and COCO-format annotation file from the VisDrone dataset.
import json
import os
import urllib.request

import matplotlib.pyplot as plt
import numpy as np
from matplotlib.patches import Rectangle
from PIL import Image
from smqtk_image_io.bbox import AxisAlignedBoundingBox

data_dir = "./data"
os.makedirs(data_dir, exist_ok=True)

url = "https://data.kitware.com/api/v1/item/623880f14acac99f429fe3ca/download"

img_path = os.path.join(data_dir, "visdrone_img.jpg")
if not os.path.isfile(img_path):
    _ = urllib.request.urlretrieve(url, img_path)  # noqa: S310
img = np.asarray(Image.open(img_path))

json_url = "https://data.kitware.com/api/v1/item/6596fde99c30d6f4e17c9eff/download"

with urllib.request.urlopen(json_url) as gt_data:  # noqa: S310
    gt = json.loads(gt_data.read().decode())

json_filename = "sample.json"
with open(os.path.join(data_dir, json_filename), "w") as f:
    json.dump(gt, f)
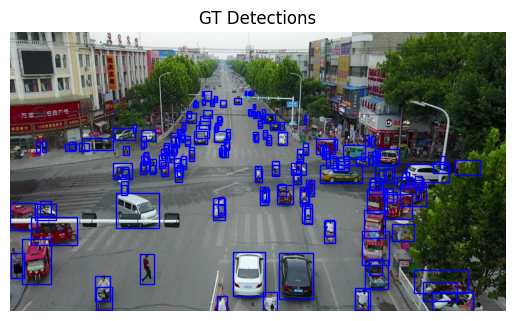
Format and Display Ground-Truth (GT) Detections
We convert the COCO annotations to the SMQTK format to make them compatible with the model and the scorer implementations.
from typing import Any


def format_detections(ann: dict[str, Any]) -> tuple[AxisAlignedBoundingBox, dict[str, Any]]:
    """Format detections in smqtk-detection format"""
    min_x, min_y, w, h = ann["bbox"]
    cat_id = ann["category_id"]
    img_id = ann["image_id"]
    return (AxisAlignedBoundingBox((min_x, min_y), (min_x + w, min_y + h)), {"category_id": cat_id, "image_id": img_id})


gt_smqtk_format = []
for i in gt["annotations"]:
    formatted_gt = format_detections(i)
    gt_smqtk_format.append(formatted_gt)

fig, ax = plt.subplots()
ax.set_title("GT Detections")
ax.imshow(img)
ax.set_axis_off()
for gt_data in gt_smqtk_format:
    bbox = gt_data[0]
    width = bbox.max_vertex[0] - bbox.min_vertex[0]
    height = bbox.max_vertex[1] - bbox.min_vertex[1]

    ax.add_patch(
        Rectangle(
            (bbox.min_vertex[0], bbox.min_vertex[1]),
            width,
            height,
            linewidth=1,
            edgecolor="b",
            facecolor="none",
        ),
    )
plt.show()
Load the Model
We generate detections using SMQTK’s custom CenterNetVisdrone model with Resnet-50 weights pretrained with the VisDrone dataset.
from smqtk_detection.impls.detect_image_objects.centernet import CenterNetVisdrone

model_file = os.path.join(data_dir, "centernet-resnet50.pth")
if not os.path.isfile(model_file):
    urllib.request.urlretrieve("https://data.kitware.com/api/v1/item/623259f64acac99f426f21db/download", model_file)

center_net_detector = CenterNetVisdrone(
    arch="resnet50",
    model_file="data/centernet-resnet50.pth",
    max_dets=500,
    use_cuda=False,
    batch_size=1,
    num_workers=1,
)

dets = list(list(center_net_detector([img]))[0])
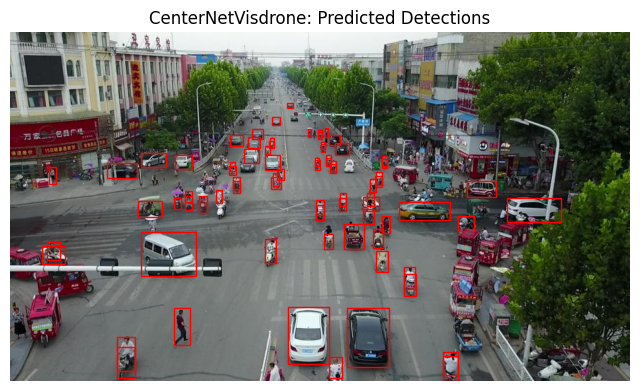
Visualize Predicted Detections
Here we visualize the detections for the test image from the CenterNetVisdrone model.
from collections.abc import Hashable

from matplotlib.axes import Axes


def show_dets(
    ax: Axes,
    dets: list[tuple[AxisAlignedBoundingBox, dict[Hashable, float]]],
    thresh: float = 0.5,
) -> None:
    """Show detections with confidence over ``thres`` on given axes"""
    for det in dets:
        score_dict = det[1]
        cls_name = max(score_dict, key=lambda key: score_dict[key])
        conf = score_dict[cls_name]

        if conf >= thresh:
            bbox = det[0]
            x_1, y_1 = bbox.min_vertex
            x_2, y_2 = bbox.max_vertex

            ax.add_patch(
                Rectangle(
                    (x_1, y_1),
                    x_2 - x_1,
                    y_2 - y_1,
                    linewidth=1,
                    edgecolor="r",
                    facecolor="none",
                ),
            )


fig, axs = plt.subplots(figsize=(8, 8))
axs.set_title("CenterNetVisdrone: Predicted Detections")
axs.imshow(img)
axs.axis("off")
show_dets(axs, dets, thresh=0.4)
Generate Scores
We test the COCOScorer implementation by generating scores for the original predictions and with a slightly perturbed version of the predictions.
from nrtk.impls.score_detections.coco_scorer import COCOScorer

scorer = COCOScorer(gt_path=os.path.join(data_dir, json_filename), stat_index=0)
print(f"Categories list: {scorer.cat_ids}")

scores_list = scorer(actual=[gt_smqtk_format], predicted=[dets])
print(f"Final COCO Eval score: {scores_list[0]}")

perturbed_dets = []
for bbox, scores in dets:
    x_1, y_1 = bbox.min_vertex
    x_2, y_2 = bbox.max_vertex
    perturbed_val = (AxisAlignedBoundingBox((x_1 + 2, y_1 + 2), (x_2 + 1, y_2 + 1)), scores)
    perturbed_dets.append(perturbed_val)

scores_list_perturbed = scorer(actual=[gt_smqtk_format], predicted=[perturbed_dets])
print(f"Final COCO Eval score (perturbed dets): {scores_list_perturbed[0]}")
Categories list: {'pedestrian': 1, 'people': 2, 'bicycle': 3, 'car': 4, 'van': 5, 'truck': 6, 'tricycle': 7, 'awning-tricycle': 8, 'bus': 9, 'motor': 10}
Final COCO Eval score: 0.3519000565337795
Final COCO Eval score (perturbed dets): 0.2632122085955557